 Launch interactive demo ↗
01 / LIVE FP&A SYSTEM
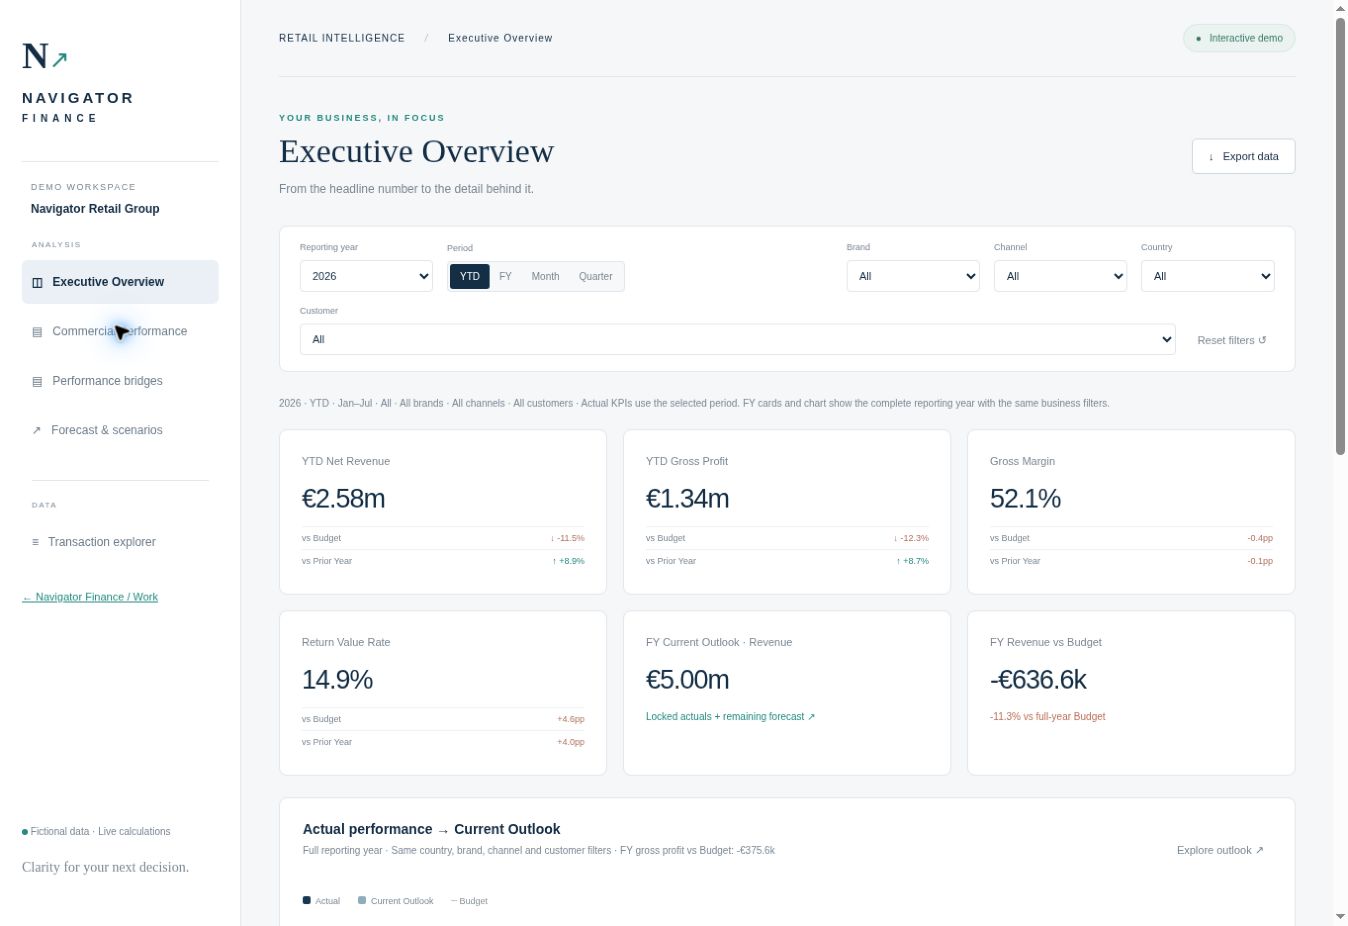
Executive Overview
See performance, key drivers, management commentary and the current full-year outlook in one view.
Launch interactive demo →Practical reporting, forecasting and financial models for growing businesses.
Turn financial and operating data into a management view you can understand — and decisions you can act on.
Actuals → Budget → Current Outlook → Scenarios
Current Outlook revenue is 12.0% above Prior Year. Explore the drivers and test what happens next.
Financial reports exist, but provide little commercial insight.
Budgets and forecasts are disconnected from actual performance.
Financial and operating data do not produce one reliable management view.
Recurring reporting that connects financial results, commercial performance, KPIs, budget, forecast and management commentary.
Improve reporting ↗02Driver-based planning, rolling forecasts, scenarios and a clearer view of cash requirements.
Build a plan ↗03Financial analysis for decisions around pricing, hiring, marketplaces, products, expansion and investment.
Assess a decision ↗LIVE INTERACTIVE DEMO ↗Revenue, margin, returns, Budget, Current Outlook and scenarios connected in one interactive management view. Built using synthetic data.
Launch interactive demo →A short-term liquidity framework connecting collections, payroll, supplier payments and scenarios.
View project approach ↗A commercial framework for commissions, returns, advertising, fulfilment and contribution economics.
View project approach ↗A good financial system should do more than display numbers. It should help management understand what changed, what is driving performance and where the business is heading.
Launch interactive demo ↗See performance, key drivers, management commentary and the current full-year outlook in one view.
Launch interactive demo →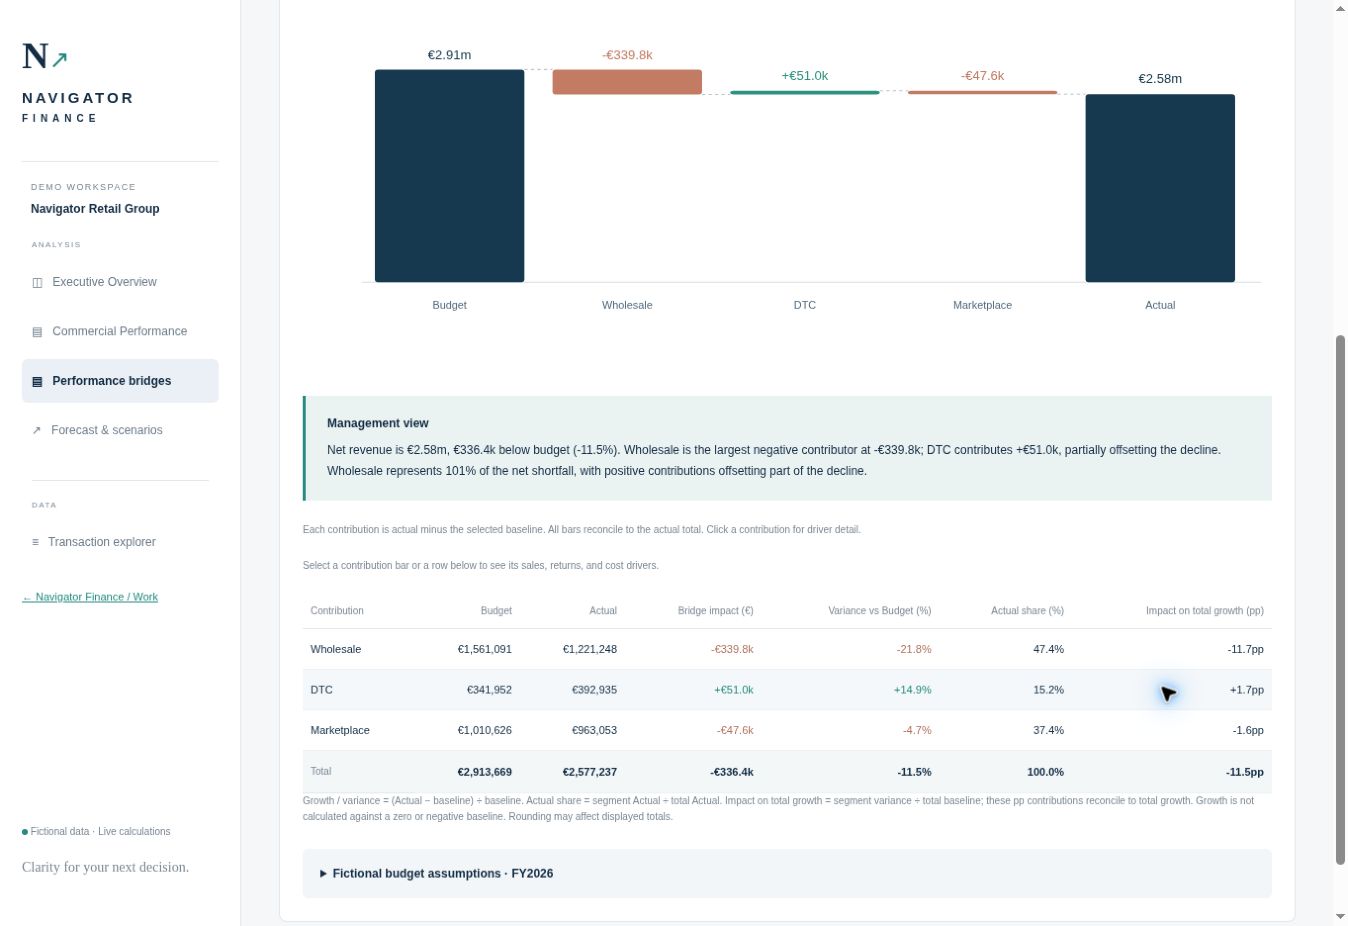 Launch interactive demo ↗
Bridge Budget to Actual and identify which brand, channel or segment created the variance.
Launch interactive demo →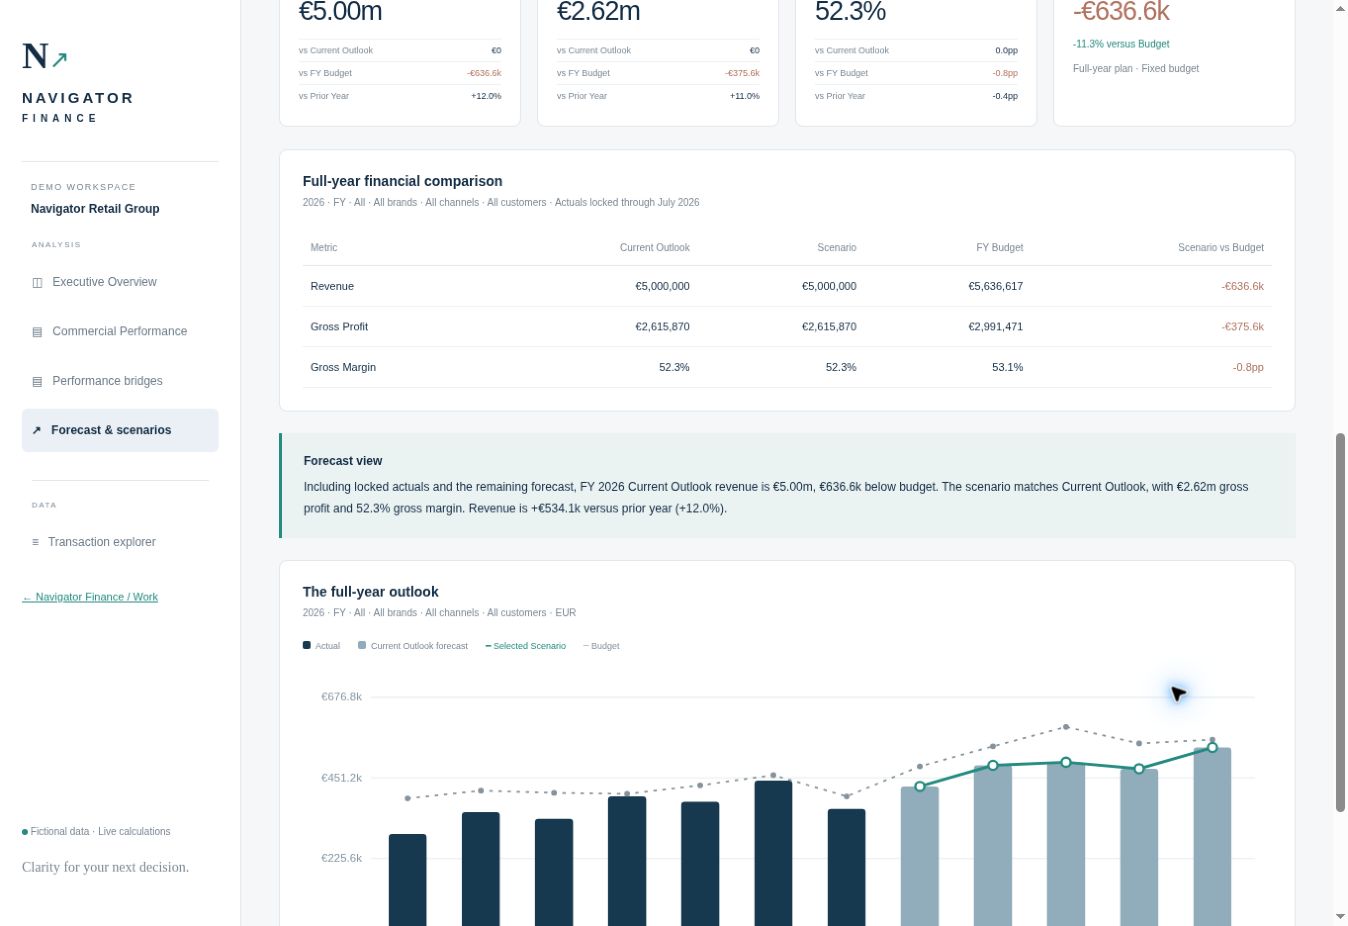 Launch interactive demo ↗
Change volume, price, cost and return assumptions and see the financial impact instantly.
Launch interactive demo →Fictional data · Live calculations
Explore the working system, using synthetic data.
Reflect actual commercial drivers, customers, channels, costs and operating structure.
Keep assumptions and calculations understandable, reviewable and easy to challenge.
Bring accounting and operational information into one coherent management view.
Use automation and AI-assisted workflows where they improve recurring finance work.
Management questions, commercial drivers and current finance processes.
Map the financial and operational sources required to answer those questions.
Create the reporting framework, financial model or decision tool.
Test, document, hand over and refine the system.

Navigator Finance was created by José Ferreira, an FP&A professional based in Amsterdam with experience across commercial finance, forecasting, budgeting, management reporting, cash-flow planning, financial control and financial modelling.
My experience spans consumer businesses, technology and financial services. My focus is on practical systems management can actually use.
More about José ↗Describe the reporting, forecasting or financial-model problem you are trying to solve. I’ll start by understanding the decision you need to make and whether Navigator Finance can help.
Discuss a project ↗